
That guesswork is expensive. When something goes wrong, you're already behind.
This guide covers the 6 carrier performance metrics every freight broker should track: on-time delivery rate, transit time consistency, load acceptance rate, claims rate, rate accuracy, and check-call compliance. For each one, you'll get the formula, what it tells you from a broker's perspective, and how to act on the data.
Key Takeaways
- On-time delivery (OTD) rate and transit time consistency are your baseline reputation metrics with shippers
- Load acceptance rate directly predicts whether a carrier will cover freight when you actually need them
- Claims and damage rate surfaces financial risk you may be absorbing silently
- Rate accuracy and check-call compliance are the most overlooked metrics — both erode margin and shipper trust faster than most brokers realize
- A carrier scorecard built on all six metrics gives you the data to reward top performers and cut chronic underperformers
Why Carrier Performance Metrics Matter for Freight Brokers
Brokers sit in the middle of every freight transaction. When a carrier misses a delivery window, the shipper calls the broker — not the driver. That asymmetry makes systematic carrier measurement non-negotiable.
The shift from reactive to proactive matters here. Without data, carrier management means responding to complaints after damage is done. With it, you spot patterns early — a carrier whose OTD is slipping on one lane, a carrier that consistently invoices above quote — before they turn into shipper complaints.
Documented performance data also gives brokers real leverage in carrier rate negotiations. Carriers who know they're being measured tend to sharpen their pricing and communicate more reliably. That data shapes three decisions in particular:
- Which carriers earn consistent freight volume through competitive pricing
- Which carriers qualify for first right of refusal on premium loads
- Which carriers get flagged for review — or removed from rotation entirely

The 6 Carrier Performance Metrics to Track
Metric 1: On-Time Delivery (OTD) Rate
Formula: (On-Time Deliveries ÷ Total Deliveries) × 100
OTD rate measures the percentage of loads delivered on or before the promised delivery date. It's the most visible metric to shippers, which makes it the most consequential for broker relationships.
According to a Coyote/RXO survey of 1,000 logistics decision-makers, 95% OTD is the most widely accepted performance benchmark — selected by 38% of shippers and 37% of carriers as the standard they hold each other to. The most common definition includes a 30-minute buffer to the appointment time.
From a broker's view, OTD is a leading indicator of contract renewal risk. A carrier consistently sitting at 88% OTD isn't just underperforming — they're putting your shipper relationship in jeopardy. The right response isn't to wait for the shipper to complain; it's to flag the pattern at 30 days and have the conversation.
Break OTD down by:
- Individual carrier
- Specific lane (Chicago–Atlanta may differ from Chicago–Dallas)
- Time period (monthly, quarterly)
That segmentation converts a single percentage into a signal — showing you exactly which carrier-lane combinations are degrading before a shipper brings it up.
Metric 2: Transit Time Consistency
OTD tells you if a shipment arrived on time. Transit time consistency tells you whether the carrier's timing is predictable — which is a different problem.
A carrier can hit 90% OTD but still be wildly inconsistent: some loads arriving 6 hours early, others squeaking in at the last minute. That variability makes it impossible to set accurate shipper expectations, especially on time-sensitive freight or lanes with tight receiving windows.
What to track: Average actual transit time vs. promised transit time, per carrier per lane, over rolling 30- or 60-day windows.
High variance — even with an acceptable OTD rate — is a red flag. It suggests the carrier is relying on margin of error rather than operational discipline. Consistent transit times mean you can tell shippers with confidence when their freight will arrive, not just hope it shows up somewhere in a window.
Metric 3: Load Acceptance Rate
Formula: (Accepted Loads ÷ Total Tendered Loads) × 100
This is the most broker-specific metric on this list — and the most underappreciated. Load acceptance rate measures what percentage of loads a carrier accepts when you tender them. A carrier that declines half your tenders isn't a capacity partner; they're an opportunistic spot player.
The same Coyote/RXO study found that 85% primary tender acceptance is the most common benchmark, selected by 35% of shippers and 33% of carriers. Context matters here: during the 2025 peak retail season, national truckload tender rejections spiked to 13.24%, which means capacity tightened sharply for brokers who hadn't built reliable carrier relationships ahead of the season.
Here's why it matters operationally:
- Low acceptance rates create coverage risk on difficult lanes
- Carriers who consistently decline may still call when the load is profitable for them — that's not a partnership
- Tracking acceptance rate separates reliable capacity from spot-market opportunists

Set minimum acceptance rate thresholds for your preferred carrier tier. If a carrier falls below it, they move down — or off — the list.
Metric 4: Claims and Damage Rate
Formula: (Number of Claims ÷ Total Shipments) × 100
Claims rate measures the percentage of shipments that result in a cargo claim for loss, damage, or shortage. Most brokers know their worst-offending carriers by memory, but without the data, pattern recognition is slow and decisions are delayed.
The financial stakes for brokers are specific. Depending on contract terms, you may face shipper chargebacks or liability exposure when a carrier's cargo handling is poor. A carrier with a 3% claims rate that mostly runs high-value freight is a liability you may be absorbing without realizing it.
Steps to manage it:
- Track claims by carrier, not just in aggregate
- Flag carriers whose claims rate exceeds your threshold before assigning them high-value or fragile freight
- Document every claim — TIA recommends maintaining rate confirmations, BOLs, emails, GPS data, and driver logs as claim evidence
Claims data also informs carrier selection at the load level. A carrier with strong OTD but elevated claims isn't safe for temperature-sensitive or fragile commodities, even if they're reliable on timing.
Metric 5: Rate Accuracy (Quoted vs. Invoiced Cost)
Rate accuracy measures the frequency and magnitude of discrepancies between the rate a carrier quotes and what they actually invoice. Unexpected accessorial charges, detention fees billed beyond agreed terms, or fuel surcharge adjustments that don't match your confirmation all erode broker margins — and create shipper disputes if passed through.
What to track: Average invoice variance per carrier, expressed as a percentage of the quoted rate.
A carrier that consistently invoices 4–8% above quote is either under-quoting to win loads or lacks billing discipline. Both are operational problems. If you're not tracking this per carrier, you're likely absorbing the variance rather than addressing the source.
Preventive steps:
- Build tighter rate confirmation language into carrier agreements
- Require itemized invoicing with any accessorials pre-approved at booking
- Carriers with repeated variance above your threshold should be flagged before the next load — not after
LaneSurf captures quoted and agreed rates at the load level and supports EDI 210 freight invoice ingestion — giving brokers the technical foundation to track invoice variance per carrier systematically.
Metric 6: Check-Call Compliance and Communication Responsiveness
Check-call compliance measures how reliably a carrier provides load status updates at agreed checkpoints — pickup confirmation, in-transit check, delivery confirmation — without you having to chase them.
When a carrier misses check-calls, you don't just lose visibility. You absorb the operational cost of chasing them down, and you lose the ability to proactively update the shipper. A 2023 FreightWaves/Tive survey of more than 500 logistics professionals found that only 20% of shippers were satisfied with visibility and communication from their logistics providers. That gap is largely a check-call problem.
Two dimensions to track:
- Check-call compliance rate — percentage of expected updates received without broker follow-up
- Response time — average time to respond to broker calls or messages during transit
LaneSurf's AI Shipment Tracking and Driver Check-Call service automates this entire workflow. The AI agent contacts drivers directly via voice or text according to your defined tracking rules. It then monitors ETAs continuously and escalates exceptions with full context before the shipper has to call.
Every check-call interaction is logged and timestamped — converting a historically manual, rep-dependent process into a trackable dataset. The platform maintains a full tracking log per shipment, giving brokers the data needed to measure check-call compliance per carrier over time.
How to Build a Carrier Performance Scorecard
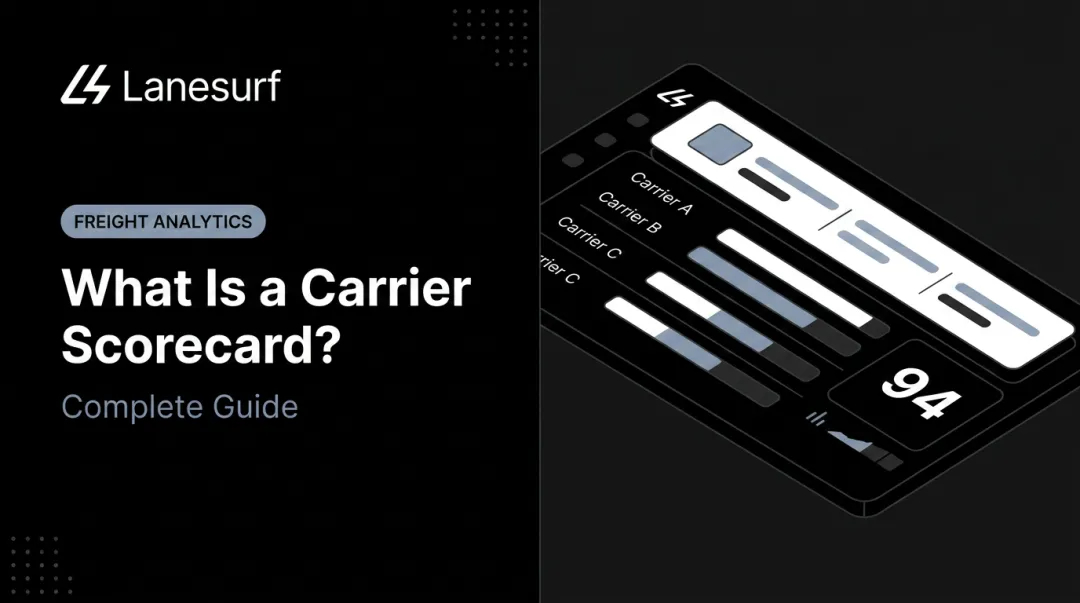
A carrier scorecard consolidates all 6 metrics into a single view per carrier — enabling direct comparison across your carrier base rather than evaluating each carrier in isolation.
Build it this way:
- Assign weights to each metric based on your business priorities. A high-volume broker focused on coverage might weight OTD and acceptance rate at 30% each; a broker moving high-value freight might weight claims rate more heavily.
- Set tiering thresholds — preferred, approved, and conditional — with clear criteria for each. A carrier drops to conditional status when any single metric falls below threshold; removal from preferred requires two or more failures.
- Review on a monthly cadence for active carriers. High-volume lanes or problem carriers may need weekly monitoring, with a full carrier base review quarterly.

The Coyote/RXO study found that 84% of carriers agree scorecards are useful for performance improvement — up from 77% in 2022. Carriers expect to be measured. The ones worth keeping respond to it.
Since carriers are already receptive to this process, share scorecards directly as part of a regular performance review. Transparency creates accountability — a carrier who knows they're at conditional status and understands exactly why will either improve or walk away.
Building and maintaining this scorecard requires consistent data. LaneSurf's Freight Operations Analytics and KPI Dashboard pulls carrier performance metrics in real time, giving operations leaders visibility across carrier performance, lane pricing, and rep productivity — without manually exporting data from a TMS.
Turning Metrics Into Action
Tracking metrics only matters if you do something with them. Here's how to put the numbers to work — on both ends of the performance spectrum.
For underperforming carriers: Lead performance conversations with specific metrics, not general dissatisfaction. "Your OTD rate on our Chicago–Atlanta lane dropped to 82% last month" is actionable. "We've been having issues with your service" is not.
Set a 30-day improvement target, document it, and follow up. If performance doesn't improve, you have a paper trail that supports removal from your preferred list.
For top performers: Use scorecard data to build a reciprocal incentive structure:
- Preferred load access on high-margin lanes
- Faster payment terms (carriers notice this)
- Volume commitments on lanes they run consistently
This rewards carriers for reliability — not just for quoting the lowest rate. The carriers worth keeping will price that relationship differently than they price a one-off spot move.
Conclusion
The six metrics — OTD rate, transit time consistency, load acceptance rate, claims rate, rate accuracy, and check-call compliance — give freight brokers a complete, quantifiable picture of carrier reliability that gut instinct alone can't provide.
Start simple. Track two or three of these consistently and the data compounds in value as patterns emerge over 60 to 90 days. You'll start making carrier decisions based on evidence rather than relationships — and that shift protects your shipper accounts and your margins.
LaneSurf's freight automation platform handles the operational touchpoints — carrier calls, load tracking, check-call follow-ups, rate capture — that generate this data in the first place, so you can build the metrics picture without adding headcount. Learn more at lanesurf.com.
Frequently Asked Questions
What are common types of carrier performance metrics?
The main categories are delivery performance (OTD rate, transit time consistency), financial performance (claims rate, invoice accuracy), and operational reliability (load acceptance rate, communication compliance). The right mix depends on your role — shippers managing contracted carriers weight differently than brokers handling dynamic capacity across dozens of carriers.
What metrics should be included on a carrier performance scorecard?
Core scorecard elements: on-time delivery rate, transit time consistency, load acceptance rate, claims and damage rate, rate accuracy, and check-call compliance. Weight each metric by its impact on your operation — coverage-focused brokers typically prioritize OTD and acceptance rate above the rest.
How often should freight brokers review carrier performance data?
Monthly reviews work well for active carrier relationships, with quarterly reviews covering the full carrier base. High-volume lanes or carriers showing early warning signs warrant weekly monitoring to catch degradation early.
What is a good on-time delivery rate benchmark for carriers?
According to a Coyote/RXO survey of 500 shippers and 500 carriers, 95% OTD is the most widely accepted benchmark across truckload and LTL. Most respondents applied a 30-minute buffer to the appointment time. Carriers falling consistently below this threshold warrant a formal performance conversation.
How can freight brokers improve a carrier's load acceptance rate?
Acceptance rates improve when brokers offer consistent freight on lanes carriers regularly run, price at fair market rates, and provide predictable tender timing. Carriers prioritize partners offering steady volume and reliable rates over brokers who only call when they're stuck on a difficult load.